
IBIE Statistics
The data that proves IBIE is right for you.
Buyers By Segment
| Segment | 2025 | What’s in it |
|---|---|---|
| Wholesale bakeries | 40% | Contract manufacturer/private label 17.9%, large wholesale 14.6%, intermediate/specialty wholesale 6.0%, wholesale bakery or commissary owned by a supermarket 1.1% |
| Retail bakeries, food service and artisan bakers | 54% | Retail bakery with wholesale arm 13.3%, single-unit retail 11.1%, multi-unit retail 7.1%, food service operation 6.8%, bakery cafe 5.6%, wholesale registrants reporting a retail bakery 3.1%, artisan bread 2.1%, specialty/gourmet 1.8%, retail chain 1.4%, panaderia 0.9%, cupcake 0.4% |
| Retail outlets | 6% | Supermarket/c-store/warehouse club 3.0%, tortilla bakery 1.1%, other 2.7% |
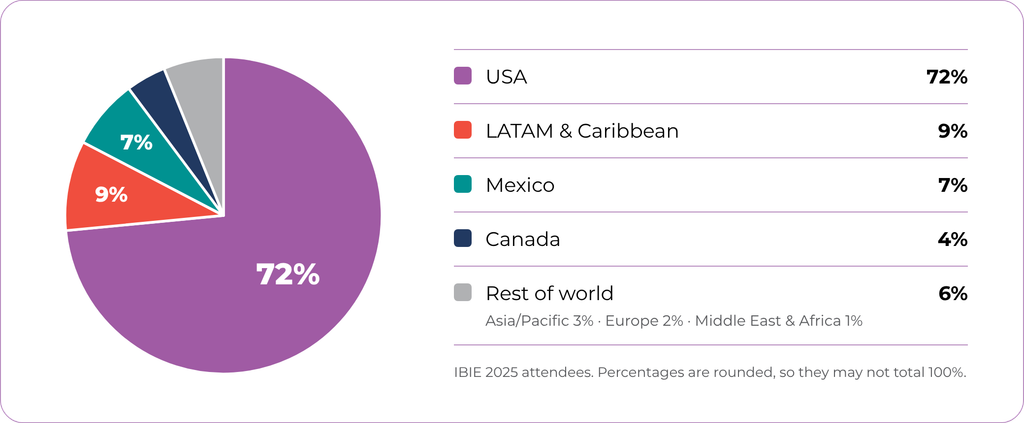
Attendees By Location
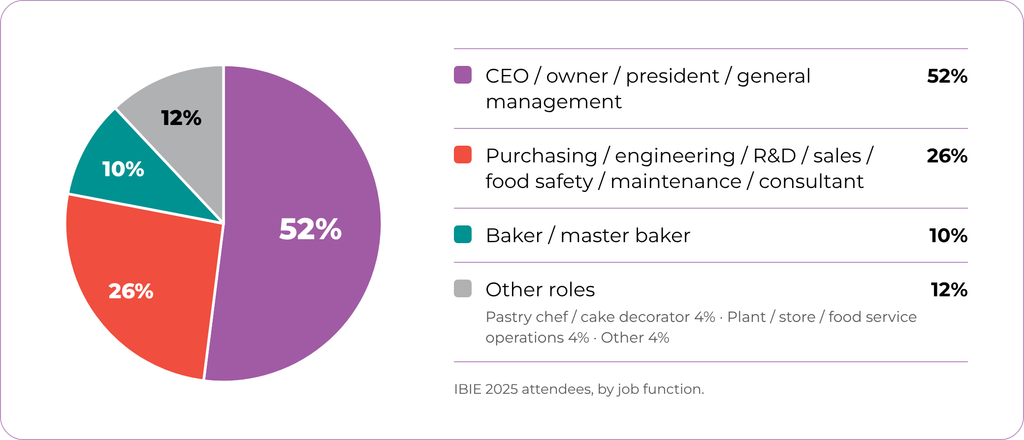
Titles of Attendees
More Demographics
| Requested Stat | 2025 Figure |
|---|---|
| 2025 Total Attendance | 18,739 total participants |
| Any major increases in 2025 attendance? | Growth areas: attendees aged 25-34 +123%; faculty +100%; press +37%; students +26%; exhibitor personnel +9%; Asian attendance +69%; international attendance outside Canada and Mexico +46%. Among wholesale registrants, the share in engineering, plant ops, R&D and QA roles rose from 34% to 40% (engineering 12.8% to 13.9%; R&D 4.9% to 6.9%). |
| % of attendees in 2025 who do not attend other shows | 37% Retail bakers 49%; wholesale bakers 35%. |
| % spending 6+ hours per day on the floor in 2025: | 60% spent 6+ hours on Monday, the peak day. Sunday 43%, Tuesday 50%, Wednesday 12%. Averaged across all four days: 41%. |
| % focused on new products and services in 2025: | 88% of buyers (92% of bakers) gave evaluating or purchasing new products, or seeing the latest innovations, as a reason for attending at registration. It was also the #1 first-choice reason: 36% of buyers. |
| Net sq ft of exhibit space in 2025: | Approximately 450,000 sq. ft., the largest show floor in IBIE’s history. |
| Exhibiting companies in 2025: | 1,005 exhibiting companies, up 9% from 2022. 486 first-time exhibitors. Record 258 international exhibitors from 37 countries (2019 high was 253 from 27). |
| % who approve, specify or recommend purchases in 2025: | 82% of buyers approve or recommend purchases (62% approve, 20% recommend. Bakers: 85%. Retail 85%, wholesale 84%. Adding “research” brings buyers to 90%. |
| Top reason attendees came in 2025: | Seeing new products & technology is #1. 29% ranked it their top reason, ahead of education (18%) and sourcing new suppliers (17%). 71% ranked it in their top three. Wholesale bakers: 44% ranked it #1. |
| % with annual purchasing budget over $100,000 in 2025: | 63% |
| % with annual purchasing budget over $1M | 30% |
| Total companies represented by attendees in 2025: | About 3,850 baking companies (1,881 wholesale + 1,973 retail). About 4,750 companies including allied suppliers. |
| % of buyers from abroad in 2025: | 28% of buyers came from outside the US (2,575 of 9,323), from 92 countries (93 across all attendees). |
Exhibitor Stats
% of 2025 exhibitors likely to return in 2028
75%
very or extremely likely to exhibit at IBIE 2028
% reporting good ROI (value received vs. time and investment) in 2025:
82%
rated IBIE 2025 a good, very good or excellent investment
Unlock Gated Resources
Complete the form below to gain instant access to all gated exhibitor resources, including the Success Guide, Demographics Report, and more.